IML 鑽孔抵抗儀resistograph
IML 鑽孔抵抗儀resistograph
硬木與早期腐朽木的高精度測量

Feed force 前進阻力
Drilling resistance 旋轉阻力
實例研究
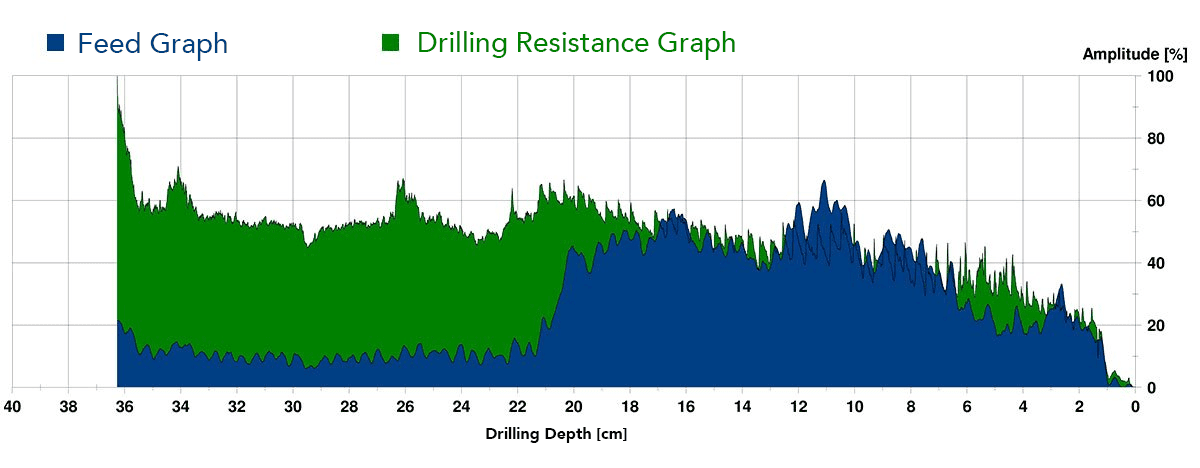
案例1: 帶有木材缺陷的熱帶硬木

前進阻力(藍色),在31公分處已明顯下降,35.5公分處後不再有任何阻力。
旋轉阻力(綠色),隨著鑽孔深度增加而穩定增加,在35.5公分處,綠色曲線下降,表示木材存在缺陷。
案例2: 真菌腐朽木材

前進阻力(藍色)在18公分處下降,表示木材在早期階段的腐朽,28.5公分後,木材很明顯降解。
旋轉阻力(綠色) 到28.5公分後下降,表明木材的缺陷更大。
案例3: 梣樹真菌腐朽

前進阻力(藍色),在12.5公分處開始明顯下降,而旋轉阻力(綠色)保持在相似幅度水平,表示在12-14公分處腐朽沒有進一步增加。
案例4:嚴重缺陷刺槐

前進阻力(藍色),在21.5公分處,比旋轉阻力(綠色) 下降更快,表示樹幹可能中空,或嚴重腐朽。
案例5: 角豆樹木材缺陷
前進阻力(藍色)在20.5公分處明顯下降,旋轉阻力(綠色)在22公分略有下降,表示這之後木材有腐朽。
筆記:
前進阻力(藍色),降低表示木材有腐朽,降到底表示嚴重腐朽或中空
旋轉阻力(綠色),會隨著鑽入深度而增加。
前進阻力降低,旋轉阻力不變
=> 木材早期腐朽
前進阻力降低,旋轉阻力降低
=> 木材嚴重腐朽或中空
前進阻力比旋轉阻力大
=> 該換針頭了
Feed force measurement – Simply know what
nobody sees – Advantage through technology
High accuracy for hard wood and early wood
decay
The feed force is the force required by the
drilling needle to penetrate the wood. Besides the drilling resistance it is
the second measured variable of the IML-RESI PowerDrill® and provides
additional information about the condition of the wood inside. While the
friction at the drilling needle shaft (shaft friction) can strongly influence
the drilling resistance, it has only a minimal influence on the feed force.
This means that the feed force together with the drilling resistance allows
very realistic results to be achieved for the evaluation of the wood.
Display of the feed force as an additional
measurement curve
The IML analysis software displays the feed
curve together with the drilling resistance curve in a graph. Both curves are
color-coded. For a precise evaluation of the measurement results, it is
important to interpret both curves in relation to each other and not just one
measurement curve in itself.
Without feed curve, shaft friction can hide
wood defects
The friction of the shaft becomes greater
the further the drilling needle presses into the wood. This influences the
drilling resistance curve and causes the curve to rise steadily. The impact of
the shaft friction cannot be separated from the actual drilling resistance.
Consequently, the measurement curve of the drilling resistance curve remains
rising even if the drilling needle penetrates a wood defect, although the
drilling resistance decreases.
Measurement of the feed force provides high
information value
In certain cases, only a comparison with
the feed curve can show how strongly the measured drilling resistance curve is
affected by the shaft friction and how large the damage in the wood actually
is. This is because the feed curve drops significantly in the case of a wood
defect and remains largely unaffected by shaft friction. In this way,
especially the wood decay in the early stages becomes visible by the feed
curve. Finally, the changes in the drilling resistance at that point in time
are still so small that they can easily be covered by the shaft friction in the
drilling resistance curve. The measurement of the feed force is also especially
advantageous for hard wood species. This is because the shaft friction is
higher with hard woods than with soft woods and therefore has a stronger
influence.
The additional measurement of the feed
force makes it possible, especially with hard woods, to detect wood decay much
earlier and more precisely than the drilling resistance measurement alone.
Case studies
The following case studies are intended to
illustrate the easy identification of wood decay through the synchronous
recording of the drilling resistance and the feed force.
Example 1: Tropical hardwood with wood
defect
The drilling curve (green) rises steadily
with increasing drilling depth due to shaft friction. At a drilling depth of
35.5 cm the drilling curve falls off, indicating a wood defect. However, it is
difficult to interpret the entire previous increase in the drilling curve. The
feed curve (blue) drops significantly already at 31 cm, and from 35.5 cm it no
longer shows any feed resistance. This indicates that timber extraction is well
advanced. The drilling curve (green), on the other hand, remains clearly raised
in its level due to the friction on the drilling needle shaft (at approx. 80%
amplitute).
Example 2: Book with brittle cinder fungus
The drilling curve (green) does not drop
significantly until 28.5 cm and indicates a larger wood defect. The feed curve
(blue), on the other hand, falls off at 18 cm and indicates wood decay in the
early stages up to a drilling depth of 28.5 cm. After that, the wood
degradation increases significantly.
Example 3: Ash with brittle cinder fungus
The feed curve (blue) drops significantly
from a drilling depth of 12.5 cm, while the drilling curve (green) remains at a
similar amplitude level, which shows no further increase in the measurement
curve between 12 – 14 cm.
Example 4: Robinia with heavy wood defect
The feed curve (blue) drops significantly
further from 21.5 cm than the drilling curve (green), which does not drop below
approx. 60% amplitude. In areas where there is almost no feed resistance
(blue), there is most likely a hollow space or advanced wood decay in the trunk
(e.g. brown rot). The difference between the amplitudes of the feed and
drilling curves results from the shaft friction.
Example 5: Carob Tree (Alfarroba) with wood
defect
From a drilling depth of 20.5 cm, the feed
curve (blue) drops off significantly, while a slight drop in the drilling curve
(green) is only visible at 22 cm and this is significantly less due to shaft
friction. The deep feed curve (blue) indicates an advanced wood decay.
Conclusion
Practical experience on hard tree species
has shown that the feed force measurement is only very slightly influenced by
shaft friction. Especially for measurements on hard tree species in connection
with an early stage of fungus-related wood decay, the feed force curve provides
a large amount of information. Feed curve decreases cannot be covered by shaft
friction effects as it can be the case with the drilling curve. An
interpretation of the drilling resistance measurement result is considerably
easier with the feed curve.
Most common areas of application
The advantage for a wood testing system
(previously only a drilling resistance measuring device) of an additional
measurement curve should be clear to everyone by now at the latest.
Tree inspection
Wood pole inspection
Construction wood inspection
Wooden playground equipment inspection
Truss Inspection
資料來源:
0 意見:
張貼留言